File:Nihms209492f2 (1).jpg

Original file (1,050 × 729 pixels, file size: 296 KB, MIME type: image/jpeg)
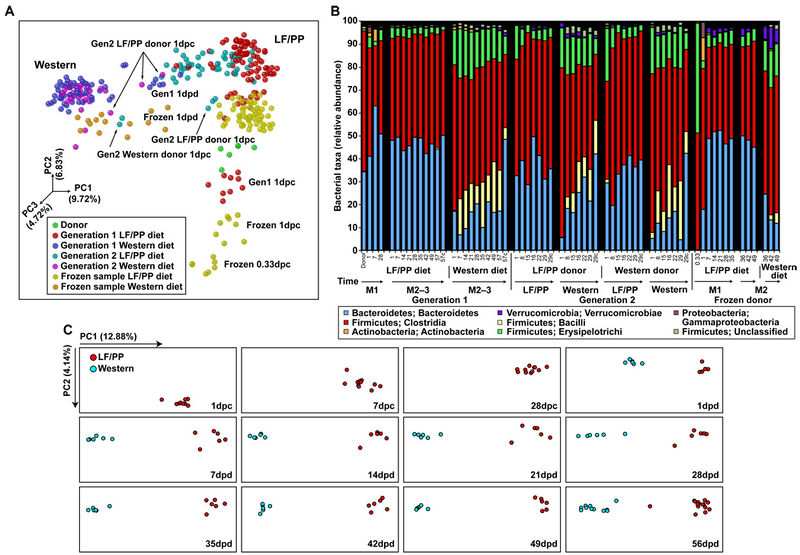
(A) 16S rRNA gene surveys [analyzed by unweighted UniFrac-based principal coordinates analysis (PCoA)] from the human donor (green), first-generation humanized mice fed LF/PP (red) or Western (blue) diets, second-generation microbiota transplant recipients consuming the LF/PP (light blue) or Western (purple) diets, and mice humanized with a frozen sample fed LF/PP (yellow) or Western (orange) diets (total of 340 samples with >800 sequences/sample). Weighted UniFrac resulted in a similar overall clustering pattern (data not shown). Principal coordinate 1 (PC1) and PC2 are the x- and y-axis, respectively, and have been scaled on the basis of percent variance. PC3 is depicted by the shading of each point. Percent variance is shown in parentheses. dpc, days post colonization with a human donor sample; dpd, days post diet switch. (B) Taxonomic distribution [RDP level 3 (class level taxa) (27)] of two generations of humanized mice fed a LF/PP or Western diet. Values represent the average relative abundance across all samples within the indicated group. C, cecal samples while all other samples are fecal; M, month. (C) 16S rRNA gene sequences (analyzed by unweighted UniFrac-based PCoA) from the mice in the experiment described in fig. 1A. The x- and y-axes are scaled based on the percent variance accounted for by each component (shown in parentheses). Each box corresponds to a single timepoint. dpc, days post colonization with the human donor sample; dpd, days post diet switch.Source: http://www.ncbi.nlm.nih.gov/pmc/articles/PMC2894525/figure/F2/
File history
Click on a date/time to view the file as it appeared at that time.
| Date/Time | Thumbnail | Dimensions | User | Comment | |
|---|---|---|---|---|---|
| current | 01:44, 22 March 2015 | | 1,050 × 729 (296 KB) | Maggie Schein15 (talk | contribs) | (A) 16S rRNA gene surveys [analyzed by unweighted UniFrac-based principal coordinates analysis (PCoA)] from the human donor (green), first-generation humanized mice fed LF/PP (red) or Western (blue) diets, second-generation microbiota transplant recipi... |
You cannot overwrite this file.
File usage
There are no pages that use this file.
.jpg&oldid=106936)
.jpg)
.jpg&action=edit&redlink=1)
.jpg&action=edit)
.jpg&action=history)
.jpg)
.jpg)
.jpg&oldid=106936)
.jpg&action=info)