File:VectorChart.png: Difference between revisions
From MicrobeWiki, the student-edited microbiology resource
(Figure 4 from Ferrua etal. (2019) showing the levels of transgenic protein after gene therapy.) |
(No difference)
|
Latest revision as of 01:28, 18 April 2022
Summary
Figure 4 from Ferrua etal. (2019) showing the levels of transgenic protein after gene therapy.
File history
Click on a date/time to view the file as it appeared at that time.
| Date/Time | Thumbnail | Dimensions | User | Comment | |
|---|---|---|---|---|---|
| current | 01:28, 18 April 2022 | 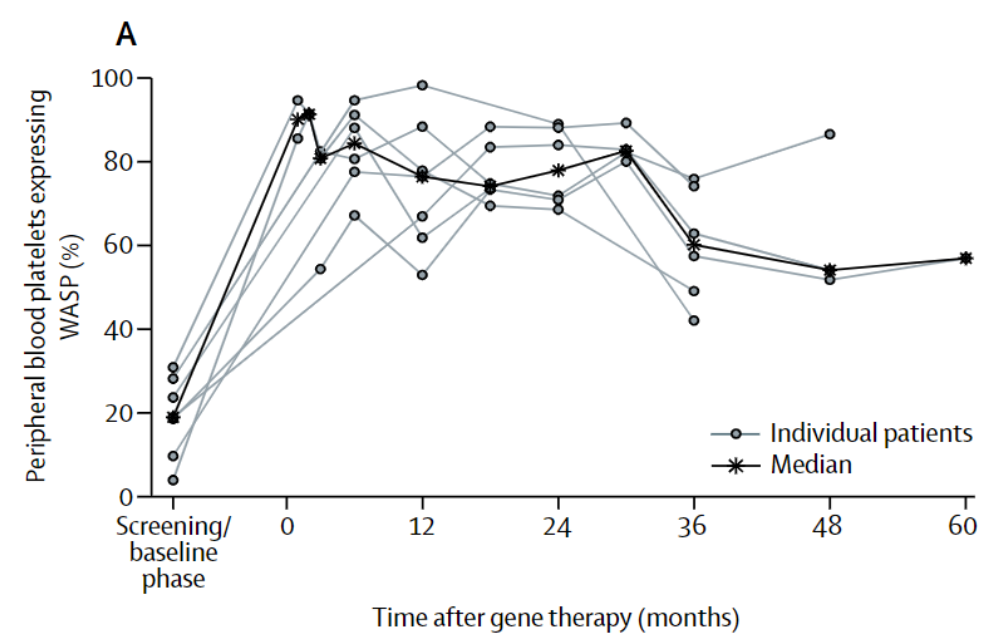 | 1,005 × 642 (187 KB) | Albrecht3 (talk | contribs) | Figure 4 from Ferrua etal. (2019) showing the levels of transgenic protein after gene therapy. |
You cannot overwrite this file.
File usage
The following page uses this file:
