File:Pnas.1005963107fig02.jpg
Pnas.1005963107fig02.jpg (592 × 479 pixels, file size: 122 KB, MIME type: image/jpeg)
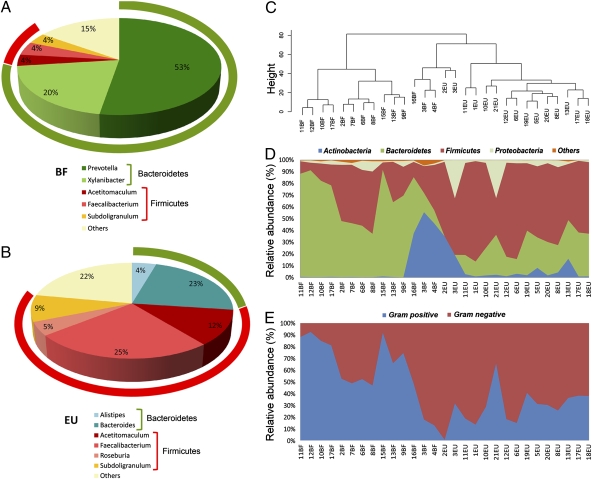
16S rRNA gene surveys reveal a clear separation of two children populations investigated. (A and B) Pie charts of median values of bacterial genera present in fecal samples of BF and EU children (>3%) found by RDP classifier v. 2.1. Rings represent corresponding phylum (Bacteroidetes in green and Firmicutes in red) for each of the most frequently represented genera. (C) Dendrogram obtained with complete linkage hierarchical clustering of the samples from BF and EU populations based on their genera. The subcluster located in the middle of the tree contains samples taken from the three youngest (1–2 y old) children of the BF group (16BF, 3BF, and 4BF) and two 1-y-old children of the EU group (2EU and 3EU). (D) Relative abundances (percentage of sequences) of the four most abundant bacterial phyla in each individual among the BF and EU children. Blue area in middle shows abundance of Actinobacteria, mainly represented by Bifidobacterium genus, in the five youngest EU and BF children. (E) Relative abundance (percentage of sequences) of Gram-negative and Gram-positive bacteria in each individual. Different distributions of Gram-negative and Gram-positive in the BF and EU populations reflect differences in the two most represented phyla, Bacteroidetes and Firmicutes.
File history
Click on a date/time to view the file as it appeared at that time.
| Date/Time | Thumbnail | Dimensions | User | Comment | |
|---|---|---|---|---|---|
| current | 21:40, 21 March 2015 | | 592 × 479 (122 KB) | Maggie Schein15 (talk | contribs) | 16S rRNA gene surveys reveal a clear separation of two children populations investigated. (A and B) Pie charts of median values of bacterial genera present in fecal samples of BF and EU children (>3%) found by RDP classifier v. 2.1. Rings represent cor... |
You cannot overwrite this file.
File usage
There are no pages that use this file.