Methanogens in Hydroelectric Dams
Introduction

By Claire Sears
Hydroelectric dams are often seen as a green, renewable energy solution to combat climate change; however, methanogenic bacteria growing in dam reservoirs produce methane, a greenhouse gas many times more potent than carbon dioxide. Arguably, the most famous hydroelectric dam in the United States is the Hoover Dam (Fig. 1), built during the Great Depression to provide jobs and energy to the country. Although hydroelectric plants have proliferated across the country, only 3% of US reservoirs are hydroelectric. Others are for protection from floods and water storage. There is relatively little attention given to this source of greenhouse gas emission both in scientific study and in consideration of dam-building. So far, scientists have not had a standard and accurate way to measure emissions, but a study by Deemer et al. in 2016 developed a measurement strategy.[1] This page will discuss the microbes responsible for the emissions from reservoirs and the factors that influence emission-levels, the measurement of emissions, and the implications for climate change and renewable energy innovation.[2]
Methane

Methane (CH4) is an abundant gas in the atmosphere produced by both natural sources and by human production[3]. As a greenhouse gas (GHG), methane is 25 to 85 times as potent as CO2, depending on the time frame in question[4]. Methane lasts in the atmosphere for approximately 10 years under typical conditions[5], meaning that in a time frame of approximately 20 years, methane has a global warming potential (GWP) 84 times greater than CO2[4]. On a 100 year time scale, methane is 28 times as potent as CO2[4].
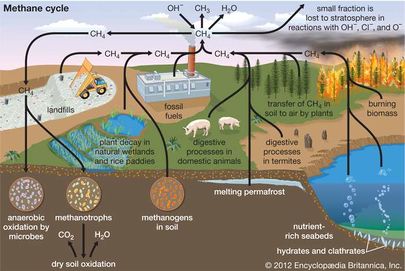
Wetlands are the greatest natural source of methane, with smaller contributions from termite digestive processes, volcanoes, ocean vents, and methane hydrate deposits beneath Antarctic and Arctic ice and along continental margins[6]. The principal human sources of methane in the atmosphere are the production and combustion of coal and natural gas, livestock farming, biomass burning, and waste management[3]. Most naturally produced methane can be offset by uptake into methane sinks such as soil where there are methane-oxidizing soil bacteria and methane oxidation by OH- in the lower levels of the atmosphere[6]. However, methane produced by humans increases atmospheric methane more rapidly than it can be offset by sinks[3]. Additionally, as methane concentration increases, there are fewer methane oxidation radicals (OH-) available in the environment to oxidize methane[3]. This prolongs the life of methane in the atmosphere and increases its greenhouse effect[3]. See Figure 2 for an overview of the methane cycle.
Methane production can also be used as a renewable source of energy by burning methane produced naturally and by human causes[5]. This process releases CO2.
Methanogenic Microbes
Methanogenesis Overview
At least 80% of atmospheric methane has been produced by obligately anaerobic methanogenic archaea, the rest being released by natural gas wells and coal deposits[5]. Generally, CO2 is used as the terminal electron acceptor in methanogenesis, while H2 functions as the electron donor[5]. Methane can also be produced from a few other substances, such as methanol, acetic acid, formic acid, and methylamines. These substances must first be converted to acetate or CO2 and H2 by other anaerobic microbes for use by methanogens[5]. By consuming hydrogen gas, methanogens support growth of other anaerobic bacteria in the environment[5].
Methanogen Diversity and Taxonomy
Within the Euryarcheota branch of Archaea are several branches of methanogens, microbial producers of methane[7]. Methanogens are highly morphologically diverse, possibly displaying as much diversity as the entire bacterial domain[7]. There are five major polyphyletic clades of methanogens. Methanosarcinales break down alcohol, acetate, and amines to methane in oceans and soil. Methanobacteriales are found in soil and animal digestive tracts. The other three clades include marine organisms and hyperthermophiles.
Methanogen Habitats and Ecology
Because methanogens can produce energy from only a small range of organic substrates, they generally live in syntrophy with other microbes that produce their required substrates[7]. One of the major habitats for methanogens is anaerobic soil found in wetlands. Wetlands producing the most methane are generally those affected by human intervention, such as rice paddies and dam reservoirs[7]. Artificial or disturbed wetlands are likely to have high concentrations of fertilizers and bacteria that convert carbon sources to methanogenic substrates, making these ideal for growth of methanogens. Other common habitats include landfills, Arctic lakes, ocean sediment, and the digestive tracts of animals, especially ruminants like cows[7]. Rising global temperatures increase the rate of methanogenesis[7].
Dams and hydroelectric energy sources
Historical use of dams
Man-made dams have been constructed across rivers and streams for centuries to hold back water, creating reservoirs[8]. A reservoir is an artificial lake. Dams have been used to prevent flooding, to divert water for agriculture and human use, and to generate mechanical power for use in mills[8]. Since the industrial revolution, dams have been used to generate electricity. According to Deemer et al., there are “847 large hydropower projects (more than 100 MW) and 2853 smaller projects (more than 1 MW) that are currently planned or under construction,” so the impact of hydroelectric dams will only continue to grow[1].
Hydroelectric dams
Hydroelectric power is generated by harnessing the potential energy of water with mechanical turbines[9]. Usually, hydroelectric power plants use dams across rivers to raise water levels and capture energy as water falls through or over dams[9]. Hydroelectric power is often touted as a green energy source because it is renewable through the hydrologic cycle, and its production does not directly emit greenhouse gases[9]. Energy demands fluctuate throughout the day, so water can be pumped to a higher level using excess electricity generated by turbines and allowed to lower at times of peak energy demand[10].
Ecological consequences
Though hydroelectric power is a renewable energy alternative, it is not without environmental and social consequences. Dams alter habitats and nutrient flows by blocking water and creating reservoirs. A well-known ecological consequence of dams is disruption of fish habitats and migration patterns[8]. They can also disrupt ecosystems by flooding surrounding areas. In Brazil, hydroelectric dams have become a very popular source of energy and numerous dams have been built on the tributaries of the Amazon River and other major rivers in Brazil, disrupting the lives of indigenous people and tropical rainforest along the river[11]. The deforestation of tropical rainforest is harmful to the global environment because it destroys a major carbon sink.
The formation of reservoirs often creates conditions ideal for methanogenesis. The construction of a hydroelectric reservoir can flood areas with large stores of terrestrial organic matter both above and below ground, which fuels microbial decomposition of organic matter to CO2 and other substrates suitable for methanogenesis[12]. Decreasing water levels on shores also leads to an increased CH4 bubbling rate. This means that oxidation processes converting CH4 to the less potent greenhouse gas CO2 in sediments and the water column are bypassed and CH4 is released directly to the atmosphere[12]. Dam reservoirs tend to have higher “catchment area-to-reservoir surface area ratios and are located on larger streams,” leading to greater loading from water, sediment, organic matter, and nutrients than in natural lakes[12].
Effect of methanogenesis in dam reservoirs
Emissions
Deemer et al. estimate that on a 100-year timescale, GHG fluxes from reservoirs are responsible for 1.3% of CO2-equivalent emissions[1]. CH4 emissions are responsible for 80% of the radiative forcing (what leads to global warming) from reservoirs on a timescale of 100 years and 90% on a timescale of 20 years, meaning that the vast majority of the contribution to global warming made by reservoirs results from methanogenesis[1]. In a review of hydroelectric and nonhydroelectric dams, “16% of reservoirs were net CO2 sinks and 15% of reservoirs were net N2O sinks, whereas all systems were either CH4 neutral or CH4 sources”[1]. The same review also found that, in contrast to popularly held belief, subtropical and midlatitude reservoirs could emit as much CH4 as tropical reservoirs.
The two emission pathways typical of both natural wetlands and dam reservoirs are ebullition (bubbling) and diffusion pathways[1]. GHG emission pathways that are negligible in natural systems but common in reservoirs include “drawdown emissions, downstream emissions, emissions from decomposing wood, and emissions from dam spillways and turbines”[1]. Drawdown emissions happen with changing water levels that alter hydrostatic pressure, and therefore alter the release of gases. Changing water levels also vary exposure of sediments to air, which changes redox conditions in sediment, which in turn affects decomposition[1]. Downstream emissions are emissions of GHGs produced in the reservoir, which pass through the dam and are emitted downstream. Dam spillways and turbines result in “degassing” by releasing gases previously trapped underwater[1]. According to Deemer et al., “both downstream and degassing emissions are likely highly dependent on reservoir GHG concentrations, dam engineering, spill practices and down-stream biogeochemistry”[1]. For example, turbines that generate energy from deeper water are likely to emit more GHGs through degassing and downstream emissions because deeper, anoxic water tends to have a higher concentration of GHGs as compared with surface water. GHGs will be trapped in the deep water as the water flows through the turbines and are carried downstream[1]. These sources of emissions are still poorly understood and quantified[1].
Influencing factors
Latitude and reservoir age have been said to predict CH4 and CO2 emissions[1]. Higher temperatures increase microbial productivity and the amount of available organic matter, so dams at lower latitudes are said to produce more greenhouse gases. Younger reservoirs are thought to have higher GHG production because of the sudden availability of organic matter that decreases over time, though the evidence backing this is contradictory[1]. Other studies have highlighted the effect of nutrient availability in reservoirs on GHG emissions. Some posit that increased nutrient availability leads to increased primary production, which makes reservoirs into carbon sinks. Others posit that it leads to eutrophication in which anaerobic conditions develop in reservoirs and dead organic matter increases, leading to an increase in GHG flux[1]. Of the characteristics studied by Deemer et al. in a review of emission studies, a higher concentration of chlorophyll a in the water and higher air temperatures were most predictive of greater CH4 emission[1]. Chlorophyll a concentration indicates eutrophic status[1].
A study quantifying differences in methane emissions from a subtropical hydroelectric reservoir over a 9.5-year period found seasonal variation in CH4 emissions[13]. The season with the lowest emission levels was the warm dry season because there was the highest stratification of the water column, which kept gases from lower layers from diffusing across the surface or rising as bubbles. Gases were released more in the warm wet season and even more so in the cool dry season when the water overturns. They also found that locations on the surface of the reservoir with more artificial mixing had higher CH4 emissions[13].

Quantification of emissions from dam reservoirs
Greenhouse gas fluxes from aquatic sources are measured using various techniques, such as “floating chambers, thin boundary methods, eddy covariance towers, acoustic methods, and funnels”[1]. The problem is that they provide varying levels of accuracy and spatial and temporal coverage[1]. In addition, common measurement techniques of aquatic GHG emissions tend to focus on diffusion of GHGs across the water-air interface, which measures CO2 and N2O fluxes well, as these gases are readily dissolved in water. However, these measurements combining water-air gas exchange with concentrations of dissolved GHGs fail to capture the extent of CH4 emissions because CH4 is far less soluble in water and tends to be released as bubbles[1]. Other methods, such as floating chambers, frequently exclude ebullition events because they “interfere with the linear accumulation of CH4 within a sampling chamber”[1]. Another difficulty is that common techniques for measuring CH4 ebullition, such as inverted funnel traps, typically only collect data over a short period of time and over a relatively low area. Therefore, measurements fail to capture the variability of fluxes over time and space[1]. New technology has improved the ability of scientists to measure ebullition rates from reservoirs; however, it is not widely used and is often costly[1]. In studies employing these new technologies (eddy covariance and acoustic methods), “mean ebullition + diffusion fluxes were over double that of diffusion-only fluxes,” highlighting how important it is to include ebullition rates in the measurement of aquatic CH4 emissions[1]. The percentage of CH4 flux from ebullition also varies enormously, making up “0% to 99.6% of total CH4 flux,” so it is important to take both ebullition and diffusion measurements[1].
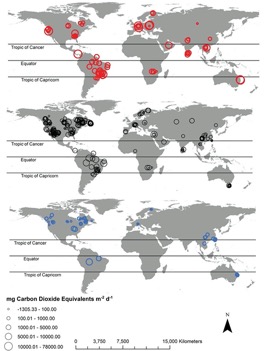
Global estimates of GHG flux depend on an accurate estimation of reservoir surface area[1]. According to Deemer et al., “Global Reservoir and Dam Database (GRAND) together with pareto-based extrapolations… estimate that reservoirs more than 0.00001 km2 cover 507,102 km2 of earth’s surface.”[1]. There are also regions with limited data on GHG emissions from reservoirs, including Russia, Australia, and Africa[1]. Figure 3 graphically shows diffusive and ebullitive emissions of three greenhouse gases on a global map. It includes data from studies of hydroelectric dam emissions compiled by Deemer et al[1]. Most studies did not have measurements for all three GHGs.

Agricultural dams
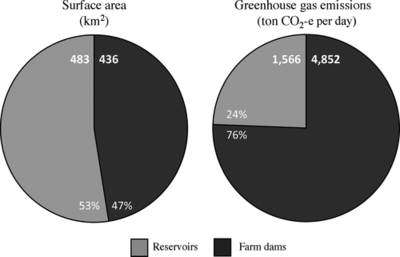
A study of GHG emissions from small agricultural dams in Australia by Ollivier et al. draws attention to the importance of including emissions from small-scale agricultural dams in global calculation of GHG emissions in addition to large hydroelectric reservoirs[14]. The study measured CH4 flux and CO2 diffusion from 77 small-scale agricultural dams found in southeast Australia. The study found that CO2-equivalent emissions from small agricultural dams were 3.1 times higher than emissions from temperate reservoirs in the state of Victoria, Australia, even though the farm dams covered only 0.94 times the surface area[14]. Figure 4 conveys this result. The left pie graph compares the reservoir surface area to farm dam surface area in southeast Australia. The graph on the right shows total emissions. Even though there is slightly higher reservoir surface area, farm dams still emit far more GHGs. They also found that nitrite concentration was positively correlated with both CO2 and CH4 emissions and that CH4 emissions were higher for livestock dams than crop-producing dams[14]. Though this study sampled from only a small geographical region, it shows that smaller agricultural dams can be huge producers of GHGs, and this is likely related to the nutrient inputs from livestock and fertilizers.
Global examples
In 2009, a yearlong study of a 90-year-old reservoir in Switzerland found the highest level of CH4 ever documented for a midlatitude hydroelectric reservoir[15]. The study measured ebullition and diffusion. Diffusion of methane from sediment was low and did not change seasonally, though dissolution of bubbles was positively correlated with water temperature.

The United States is home to 2198 dams actively producing hydropower[16]. A study of dams in the United States found that GHG emissions were site specific and that GHG emissions from hydroelectric reservoirs were much lower than those in tropical regions[17]. Diversion dams had lower emission rates than dams with reservoirs[17]. This makes sense, following the idea that organic matter and nutrient buildup allows for the growth of methanogens beneath the water’s surface. However, as this study was a review of other studies, the findings may be susceptible to bias from the lack of measurement of CH4 ebullition. A study of two hydroelectric reservoirs in eastern Washington found that over 97% of methane emissions came from methane ebullition and that ebullition rates in the summer were higher than those of six hydroelectric reservoirs in the southeastern U.S.[16].
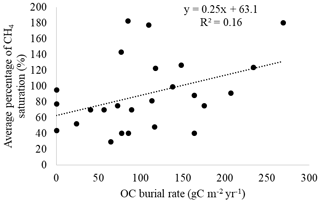
Hydroelectric power has seen huge popularity and growth in the Amazon basin. In recent years, methane emission from hydroelectric reservoirs has been increasingly studied. Quadra et al. pointed this out and the fact that there has been little investigation into the organic material buried by hydroelectric reservoirs[18]. The study found high levels of organic matter in reservoir sediment. It also found that 23% of sediment samples had dissolved CH4 levels above saturation concentration, “indicating a high potential for CH4 ebullition”[18]. The study shows that while organic matter burial in reservoirs could be considered a form of carbon sequestration, it can also mean increased carbon availability for methanogenic microbes operating in anoxic conditions in the sediments of hydroelectric reservoirs[18]. Figure 5 shows a figure from the paper by Quadra et al. showing the positive correlation between organic matter burial found at different sites in the Curuá Una hydroelectric reservoir and CH4 emissions at those sights.
In China, although hydroelectric dams contribute GHG emissions 2-fold greater than in temperate zones, hydroelectric power produces 7% of the GHGs of a typical coal-fired plant, making hydroelectricity a relatively green alternative to the main source of electricity, according to Li et al.[19]. One of the strengths of their study was that it quantified emissions from degassing and drawdown; however, it sourced reservoir surface emissions from other available research, which may have been subject to the lack of proper quantification of CH4 ebullition discussed earlier.
Remediation and solutions
One option for reducing the greenhouse effect of GHGs produced in hydroelectric reservoirs is to capture the methane and use it as an energy source[20]. Since the methane is already being produced, capturing it and using it to produce electricity converts it to CO2, a less potent greenhouse gas, and extends the energetic capacity of a hydroelectric plant. This would mitigate the greenhouse effect produced by existing hydroelectric reservoirs and reduce dependency on fossil fuels.
As nearly every article cited here says, the most important measure is the inclusion of reservoir emissions in global emissions calculations. That would ensure that methane produced and released to the atmosphere by methanogens in hydroelectric dams would be taken into account when assessing possible renewable energy projects. Understanding the conditions that lead to increased methanogenesis in reservoirs may influence design and location choices in order to reduce emissions. Additional knowledge may also lead to decisions to develop other sources of renewable energy that do not produce as many GHG emissions, such as solar or wind energy.
Conclusions
Though there has been a lot of study in recent years on methanogenesis in hydroelectric reservoirs, it still is not widely known that hydroelectric plants are major sources of greenhouse gases, and there is still much to be understood. Studies with a consistent and accurate way to measure methane emissions are still needed. It would also be valuable to develop methods to accurately and cheaply quantify methane emission from degassing and downstream emissions. Quantification of CH4 emissions from regions lacking data would be tremendously useful both in determining factors that contribute to methanogenic conditions and in calculating overall emissions on a global scale. Deemer et al. emphasize the importance of timescale[1]. Methane is an extremely potent greenhouse gas that has the greatest effect in the 10-20 years after emission. Making decisions that reduce methane emissions will have the greatest immediate effect.
References
- ↑ 1.00 1.01 1.02 1.03 1.04 1.05 1.06 1.07 1.08 1.09 1.10 1.11 1.12 1.13 1.14 1.15 1.16 1.17 1.18 1.19 1.20 1.21 1.22 1.23 1.24 1.25 1.26 1.27 1.28 1.29 [Deemer, B. R.; Harrison, J. A.; Li, S.; Beaulieu, J. J.; DelSontro, T.; Barros, N.; Bezerra-Neto, J. F.; Powers, S. M.; dos Santos, M.A.; Vonk, J. A.; Greenhouse Gas Emissions from Reservoir Water Surfaces: A New Global Synthesis 2016. BioScience, 66:11:949-964. https://doi.org/10.1093/biosci/biw117.]
- ↑ Weiser, M. "The hydropower paradox: is this energy as clean as it seems?" 2016. The Guardian 6:2634-2637.
- ↑ 3.0 3.1 3.2 3.3 3.4 [Methane. (2018, December 28). Encyclopædia Britannica. Retrieved April 23, 2020, from https://www.britannica.com/science/methane]
- ↑ 4.0 4.1 4.2 [Myhre, G., D. Shindell, F.-M. Bréon, W. Collins, J. Fuglestvedt, J. Huang, D. Koch, J.-F. Lamarque, D. Lee, B. Mendoza, T. Nakajima, A. Robock, G. Stephens, T. Takemura and H. Zhang, 2013: Anthropogenic and Natural Radiative Forcing. In: Climate Change 2013: The Physical Science Basis. Contribution of Working Group I to the Fifth Assessment Report of the Intergovernmental Panel on Climate Change [Stocker, T.F., D. Qin, G.-K. Plattner, M. Tignor, S.K. Allen, J. Boschung, A. Nauels, Y. Xia, V. Bex and P.M. Midgley (eds.)]. Cambridge University Press, Cambridge, United Kingdom and New York, NY, USA. https://www.ipcc.ch/site/assets/uploads/2018/02/WG1AR5_Chapter08_FINAL.pdf]
- ↑ 5.0 5.1 5.2 5.3 5.4 5.5 [Rogers, K., & Kadner, R. J.. (2019, June 20). Bacteria. Encyclopædia Britannica. https://www.britannica.com/science/bacteria]
- ↑ 6.0 6.1 [Mann, M. E. (2019, March 19). Greenhouse gas. Encyclopædia Britannica. https://www.britannica.com/science/greenhouse-gas]
- ↑ 7.0 7.1 7.2 7.3 7.4 7.5 [Slonczewski, J. L., & Foster, J. W. (2019). Microbiology: An Evolving Science (5th ed.) W. W. Norton & Company, Inc.]
- ↑ 8.0 8.1 8.2 [Dams. (2019, July 29). National Geographic Society. Retrieved April 23, 2020, from https://www.nationalgeographic.org/encyclopedia/dams/]
- ↑ 9.0 9.1 9.2 [Hydroelectric Power. (2020, March 21). Encyclopædia Britannica. Retrieved April 23, 2020, from https://www.britannica.com/science/hydroelectric-power]
- ↑ [Mossman, M. (2019, March 15). Renewable energy debate. CQ researcher, 29, 1-58. Retrieved from http://library.cqpress.com/]
- ↑ [Hoag, C. (2017, April 7). Troubled Brazil. CQ researcher, 27, 289-312. Retrieved from http://library.cqpress.com/]
- ↑ 12.0 12.1 12.2 [Falter, C. M. (2017, March). Greenhouse Gas Emissions from Lakes & Reservoirs: The Likely Contribution of Hydroelectric Project Reservoirs on the Mid-Columbia River. Chelan PUD. www.chelanpud.org/docs/default-source/default-document-library/chelan-pud-mid-columbia-river-hydro-project-greenhouse-gas-emissions.pdf.]
- ↑ 13.0 13.1 [Guérin, F., Deshmukh, C., Labat, D., Pighini, S., Vongkhamsao, A., Guédant, P., Rode, W., Godon, A., Chanudet, V., Descloux, S., & Serça, D. (2016). Effect of sporadic destratification, seasonal overturn, and artificial mixing on CH4 emissions from a subtropical hydroelectric reservoir. Biogeosciences, 13(12), 3647–3663. https://doi-org.libproxy.kenyon.edu/10.5194/bg-13-3647-2016]
- ↑ 14.0 14.1 14.2 [Ollivier, Q. R., Maher, D. T., Pitfield, C., & Macreadie, P. I. (2019). Punching above their weight: Large release of greenhouse gases from small agricultural dams. Global Change Biology, 25(2), 721–732. https://doi-org.libproxy.kenyon.edu/10.1111/gcb.14477]
- ↑ [DELSONTRO, T., MCGINNIS, D. F., SOBEK, S., OSTROVSKY, I., & WEHRLI, B. (2010). Extreme Methane Emissions from a Swiss Hydropower Reservoir: Contribution from Bubbling Sediments. Environmental Science & Technology, 44(7), 2419–2425. https://doi-org.libproxy.kenyon.edu/10.1021/es9031369]
- ↑ 16.0 16.1 [Miller, B., Arntzen, E., Goldman, A., & Richmond, M. (2017). Methane Ebullition in Temperate Hydropower Reservoirs and Implications for US Policy on Greenhouse Gas Emissions. Environmental Management, 60(4), 615–629. https://doi-org.libproxy.kenyon.edu/10.1007/s00267-017-0909-1]
- ↑ 17.0 17.1 [Song, C., Gardner, K. H., Klein, S. J. W., Souza, S. P., & Mo, W. (2018). Cradle-to-grave greenhouse gas emissions from dams in the United States of America. Renewable & Sustainable Energy Reviews, 90, 945–956. https://doi-org.libproxy.kenyon.edu/10.1016/j.rser.2018.04.014]
- ↑ 18.0 18.1 18.2 [Quadra, G. R., Sobek, S., Paranaíba, J. R., Isidorova, A., Roland, F., do, V. R., & Mendonça, R. (2020). High organic carbon burial but high potential for methane ebullition in the sediments of an Amazonian hydroelectric reservoir. Biogeosciences, 17(6), 1495–1505. https://doi-org.libproxy.kenyon.edu/10.5194/bg-17-1495-2020]
- ↑ [Li, S., Zhang, Q., Bush, R., & Sullivan, L. (2015). Methane and CO emissions from China’s hydroelectric reservoirs: a new quantitative synthesis. Environmental Science & Pollution Research, 22(7), 5325–5339. https://doi-org.libproxy.kenyon.edu/10.1007/s11356-015-4083-9]
- ↑ [Bambace, L. A. W., Ramos, F. M., Lima, I. B. T., & Rosa, R. R. (2007). Mitigation and recovery of methane emissions from tropical hydroelectric dams. Energy, 32(6), 1038–1046. https://doi-org.libproxy.kenyon.edu/10.1016/j.energy.2006.09.008]
Authored for BIOL 238 Microbiology, taught by Joan Slonczewski, 2018, Kenyon College.
