File:Spectra data for GSB 1 Cells.png: Difference between revisions
From MicrobeWiki, the student-edited microbiology resource
(Figure 5. Absorption (solid line) and fluorescence emission (broken line) spectra of GSB1 intact cells. Vertical axis gives absorbance_fluorescence (arbitrary units) and horizontal axis gives wavelengths in nanometers. Image courtesy of Beatty et al. (3).) |
(No difference)
|
Latest revision as of 05:03, 1 May 2009
Figure 5. Absorption (solid line) and fluorescence emission (broken line) spectra of GSB1 intact cells. Vertical axis gives absorbance_fluorescence (arbitrary units) and horizontal axis gives wavelengths in nanometers. Image courtesy of Beatty et al. (3).
File history
Click on a date/time to view the file as it appeared at that time.
| Date/Time | Thumbnail | Dimensions | User | Comment | |
|---|---|---|---|---|---|
| current | 05:03, 1 May 2009 | 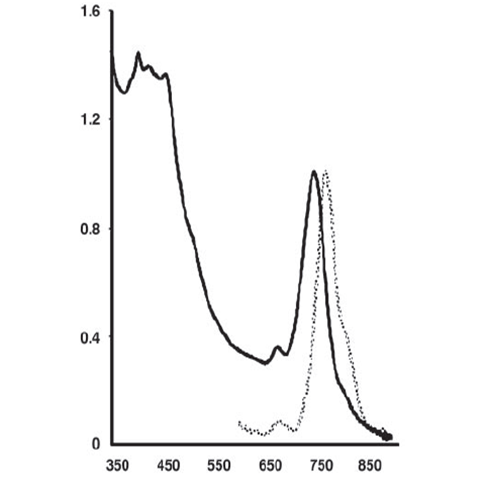 | 487 × 488 (51 KB) | Eldahank (talk | contribs) | Figure 5. Absorption (solid line) and fluorescence emission (broken line) spectra of GSB1 intact cells. Vertical axis gives absorbance_fluorescence (arbitrary units) and horizontal axis gives wavelengths in nanometers. Image courtesy of Beatty et al. (3). |
You cannot overwrite this file.
File usage
The following page uses this file: