The Role of Bacteria in the Health Potential of Yogurt: Difference between revisions
| Line 59: | Line 59: | ||
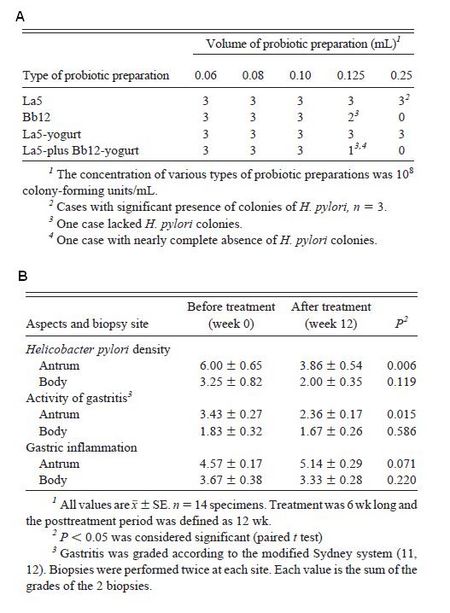
[[Image:h pylori data.jpg|thumb|450px|left|Fig. 8. The effect of probiotics on suppressing <i>Helicobacter pylori</i> density and infection. (A) Number of <i>H. pylori</i> colonies depending on the concentration and type of probiotic bacteria present on the plate. La5 refers to <i>Lactobacillus acidophilus</i> and Bb12 refers to <i>Bifidobacterium lactis</i>. (B) Characteristics of biopsy sites before and after yogurt treatment containing La5 and Bb12. <i>H. pylori</i> density was graded from 0 to 5, while activity of gastritis and gastric inflammation were graded on a scale of 0 to 4. Each value is a sum of 2 biopsies. Courtesy of Wang et al., 2004.]] | [[Image:h pylori data.jpg|thumb|450px|left|Fig. 8. The effect of probiotics on suppressing <i>Helicobacter pylori</i> density and infection. (A) Number of <i>H. pylori</i> colonies depending on the concentration and type of probiotic bacteria present on the plate. La5 refers to <i>Lactobacillus acidophilus</i> and Bb12 refers to <i>Bifidobacterium lactis</i>. (B) Characteristics of biopsy sites before and after yogurt treatment containing La5 and Bb12. <i>H. pylori</i> density was graded from 0 to 5, while activity of gastritis and gastric inflammation were graded on a scale of 0 to 4. Each value is a sum of 2 biopsies. Courtesy of Wang et al., 2004.]] | ||
<br><br><br><br><br><br><br><br><br><br><br><br><br><br><br><br><br><br><br><br><br><br><br><br><br><br><br><br><br><br><br><br><br><br><br><br><br><br><br><br><br><br><br> | <br><br><br><br><br><br><br><br><br><br><br><br><br><br><br><br><br><br><br><br><br><br><br><br><br><br><br><br><br><br><br><br><br><br><br><br><br><br><br><br><br><br><br> | ||
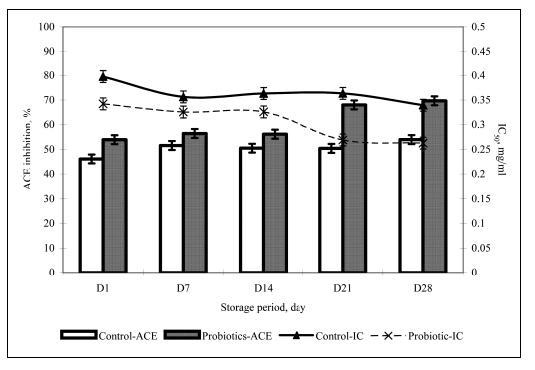
[[Image:ACE inhibition.jpg|thumb|600px|left|Fig. 9. The amount of ACE-inhibitory activity as depicted by the bars and IC50, the sample concentration in mg/mL of probiotic cultures in soy yogurt, as depicted by the lines. Fermentation was halted at pH 4.50 and the samples were stored at 4°C for 28 days. Courtesy of Donkor et al., 2005.]] | [[Image:ACE inhibition.jpg|thumb|600px|left|Fig. 9. The amount of ACE-inhibitory activity as depicted by the bars and IC50, the sample concentration in mg/mL of probiotic cultures in soy yogurt needed to inhibit ACE activity by 50%, as depicted by the lines. Fermentation was halted at pH 4.50 and the samples were stored at 4°C for 28 days. Courtesy of Donkor et al., 2005.]] | ||
Revision as of 11:13, 17 April 2010
Introduction
At right is a sample image insertion. It works for any image uploaded anywhere to MicrobeWiki. The insertion code consists of:
Double brackets: [[
Filename: PHIL_1181_lores.jpg
Thumbnail status: |thumb|
Pixel size: |300px|
Placement on page: |right|
Legend/credit: Electron micrograph of the Ebola Zaire virus. This was the first photo ever taken of the virus, on 10/13/1976. By Dr. F.A. Murphy, now at U.C. Davis, then at the CDC.
Closed double brackets: ]]
Other examples:
Bold
Italic
Subscript: H2O
Superscript: Fe3+
Biochemistry of Yogurt Production
Introduce the topic of your paper. What microorganisms are of interest? Habitat? Applications for medicine and/or environment?
Yogurt Production
Benefits of Yogurt
Include some current research, with at least one figure showing data.
Probiotics
Include some current research, with at least one figure showing data.
Lactobacillus casei
Lactobacillus acidophilus
Bifidobacterium species
Improving Yogurt
Current Problems
Include some current research, with at least one figure showing data.
Improving functionality of Yogurt
A "Superior" Yogurt
Conclusion
Overall text length at least 3,000 words, with at least 3 figures.
References
Edited by student of Joan Slonczewski for BIOL 238 Microbiology, 2010, Kenyon College.
